Rollover and the front month
A futures contract expires. The one you traded in September is not the one you trade in December, and the day the volume moves from one to the other is the day charts jump, indicators reset and a stop can sit on a contract nobody is trading any more.
Why there is more than one ES
Symbols like ES 12-26 or ES DEC26 name a
specific contract that settles on a specific date. Equity index futures
list quarterly, in March, June, September and December, which is where
the letters H, M, U and Z come from in older symbol formats.
At any moment several of them are trading. Almost all the volume sits in one, called the front month, and that is the one you want to be in. The others are thin, and thin means wider spreads and worse fills for the same idea.
| Month | Code | Typical listing |
|---|---|---|
| March | H | Equity index quarterly |
| June | M | Equity index quarterly |
| September | U | Equity index quarterly |
| December | Z | Equity index quarterly |
Energy and metals list far more months than four a year, so crude and gold roll on a different rhythm to the index contracts. If you trade both, they will not roll on the same day.
What rollover actually is
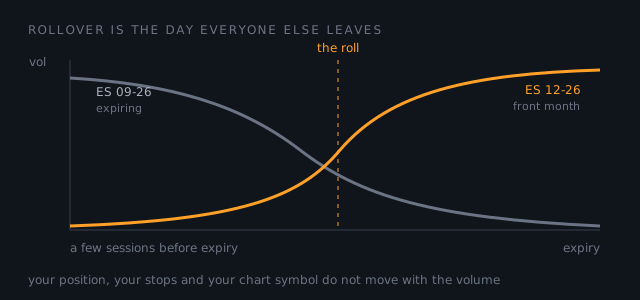
Rollover is not an event the exchange performs on your position. It is simply the day traders collectively move to the next contract. Volume drains out of the expiring month over a few sessions and appears in the next one.
Two consequences follow, and both catch people:
- Your position does not move with it. If you are long
ES 09-26and everyone else has gone to12-26, you are still long 09-26, in a market that is emptying out. Closing and reopening in the new contract is a decision you make, not one that happens to you. - Prices differ between contracts. The next month usually trades at a different price to the expiring one, because it prices a different point in the future. That gap is not a move in the market and there is nothing to trade in it.
This is why charts appear to gap on rollover day. A continuous chart stitches contracts together, and depending on the adjustment method the historical prices behind the join may be shifted to remove the gap, or left alone so the gap shows. Neither is wrong. But it does mean a level you drew last month may sit at a different number today, and a backtest that ignores the join is measuring a price series nobody could have traded.
What to check on the day
- Which contract has the volume. Not the calendar, the volume. The roll happens when traders do it, and that is usually a few sessions before expiry rather than on expiry itself.
- Your chart symbol. Some setups follow the front month automatically and some stay pinned to the contract you typed. A chart quietly showing an expiring contract is a chart showing something increasingly unlike the market.
- Resting orders. Stops and targets belong to the contract they were placed on. They do not migrate.
- Indicator warm-up. Anything with a lookback needs history. On a fresh contract, check that your indicators have enough bars behind them to mean what they normally mean.
What it does to your records
Your exported trades will carry both contract names, so a quarter of trading on the S&P looks like two instruments rather than one. That splits any per instrument statistic straight down the middle, which matters most for anything measuring a typical size, because two half samples can each be too small to say anything.
The Trade Lab handles this by grouping on the
root symbol: ES 09-26 and ES 12-26 are both
ES, and the stop baseline it builds is per instrument across
the roll rather than per contract. If you keep your own spreadsheet, it
is worth doing the same thing there.
Sources checked
- CME Group, contract month codes, the source of the four codes in the table above: March is H, June is M, September is U, December is Z.
- CME Group, E-mini S&P 500 contract specifications, where the listed contract months and the termination day for ES are published. The specification is the authority on both, and it is the page to check before a roll rather than this one.