How to export your Trade Performance CSV
The Display selector in Trade Performance offers six views. Three of them export files that look much alike, and only one of those has a row per trade. Here is the one you want, the clicks to get it, and what the other two look like when you have exported them by mistake.
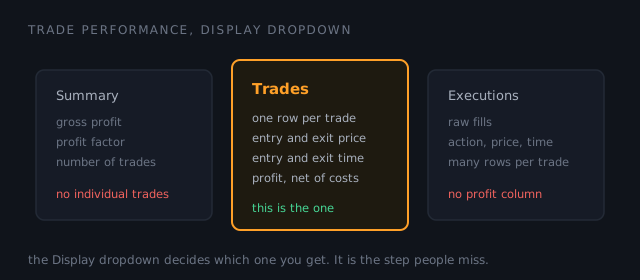
The export you want
You are after the Trades grid: one row per completed trade, with entry and exit prices, times, and a profit figure. Not raw fills, and not the totals.
That profit figure is net of whatever costs your account is set up to charge. With a commission template configured, it already has them taken out. With none configured there is nothing to take out, and the same column is gross. The section on columns below says the same thing about the cost columns, and it is worth knowing which case you are in before reading any cost figure anywhere, here or in the Trade Lab.
- In the Control Center, choose New, then Trade Performance.
- Set the Display dropdown, top left, to Trades. This is the step that decides whether the file is usable, and it is the one most people miss.
- Choose your account and the date range you want to look at, then generate the report.
- Right-click anywhere in the grid and choose Export. Save it as CSV.
Nothing leaves your machine when you use the Lab. The Trade Lab reads the file in your browser and builds the debrief there. Your export is never uploaded, which is why you can drop a real account's history on it without thinking twice.
The two files people export by accident
Both come out of the same window, and both look plausible until you try to use them.
| What you exported | How to tell | Fix |
|---|---|---|
| Performance summary | A short file of totals: gross profit, profit factor, number of trades. No individual trades in it. | Same window, set Display to Trades, export again. |
| Executions | Columns like Action, Price,
Time, and no profit column. These are raw fills, so
one trade may be several rows. |
Same window, set Display to Trades. Executions cannot be turned into trades afterwards without guessing how fills pair up. |
What a good file contains
Column names shift a little between NinjaTrader versions and grid layouts, which is fine. What matters is that these are present:
- Instrument, so sessions can be split by contract.
- Market pos. (or Position, or Side), giving long or short.
- Entry price and Exit price.
- Entry time and Exit time. Without these, trades cannot be put in order or grouped into sessions.
- Profit. Use NinjaTrader's exported Profit as the trade result, and keep every cost column the export offers so the costs actually present in your file can be accounted for separately. What lands in those columns depends on the commission template configured on your account, so treat the export as the record of your own setup rather than a universal statement about NinjaTrader.
Fees live in up to five separate columns. Commission,
clearing fee, exchange fee, IP fee and NFA fee. Reading only
Commission and calling it your cost is a common way to
conclude you are losing 18 cents a trade to fees when the real figure
is several times that. Keep every cost column in the export.
Dates that come out ambiguous
If your regional settings write dates day-first, a file whose every
timestamp falls in the first twelve days of a month is genuinely
ambiguous: 05/03/2026 could be March or May, and nothing in
the file settles it. The honest fix is to make it unambiguous at the
source rather than let software guess, because guessing wrong reorders
your session and quietly stitches an equity curve across unrelated days.
Either re-export with a date format that includes an unambiguous month,
or convert the timestamp column to YYYY-MM-DD in a
spreadsheet before you use the file anywhere.
The Lab does not guess silently. When a file settles its own date order it uses it; when nothing in the file settles it, the Lab says so on the page and tells you it has assumed month-first. A file that actively contradicts itself is refused rather than parsed, because a wrong guess there stitches an equity curve across unrelated days.
Then what
Drop the file on the Trade Lab and it builds the session debrief: expectancy, behaviour flags, execution grades, and an hour-by-hour breakdown of when your trading actually worked. It runs in your browser and nothing uploads.
Sources checked
- NinjaTrader 8 Help Guide, Using Trade Performance, lists the six Display views the selector offers: Summary, Analysis, Executions, Trades, Orders and Journal. Three of them export files that look much alike, which is the confusion this page exists to end.
- NinjaTrader 8 Help Guide, Performance Displays, defines the Trades display as completed transactions "sorted by time and matched by the market position and quantity", and the Executions display as every historical execution, which is the difference this page turns on. Its list of Trades columns names
Commissionas the only cost column. - A Trades export from NinjaTrader 8.1, our own, with the account number removed. It carries four cost columns the help guide does not list: clearing, exchange, IP and NFA fees. Its Profit is the price move less all five costs, not less commission alone: the first trade moved $5.00, carried $1.28 of costs of which $0.18 was commission, and shows $3.72. The cost advice above rests on this file.