How to read a NinjaTrader performance report
The summary hands you a dozen numbers with equal weight, and they are not equally useful. Here is what each of the main ones is telling you, which of them can be true and misleading at the same time, and the questions no summary can answer.
Profit factor
profit factor = gross profit ÷ gross loss
Above 1.0 means the winners outweighed the losers over the period. It is the fastest read on the page and the easiest to over-trust, for two reasons.
First, one outlier can carry it. A profit factor of 1.6 built from a single enormous win sitting on top of forty small losses is a different business from a 1.6 built evenly, and the number cannot tell them apart. Second, it says nothing about the path. Two accounts can end the month with the same profit factor, one having drifted up gently and the other having been down 40% in the middle of it.
Expectancy, the number that scales
expectancy = (win rate × average win) − (loss rate × average loss)
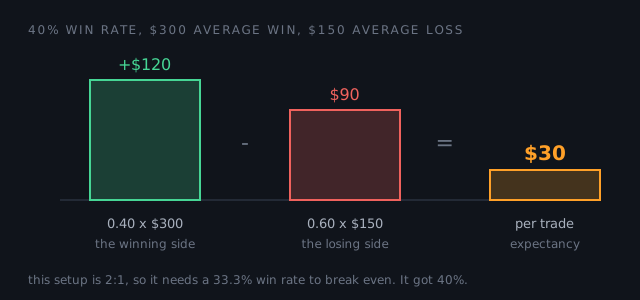
This is the average dollar result of taking the trade once. Worked through, with a 40% win rate, a $300 average win and a $150 average loss:
- Winning side: 0.40 × $300 = $120
- Losing side: 0.60 × $150 = $90
- Expectancy: $120 − $90 = $30 per trade
The reason to prefer it over profit factor is that it multiplies. If a $30 expectancy held across 100 comparable trades, the expected result would be $3,000, which is something you can plan against. A profit factor of 1.33 projects nothing on its own.
Expected is doing real work in that sentence. It is the average of the outcomes, not a forecast of one of them, and the actual hundred trades can land a long way either side of it.
They are the same two facts wearing different clothes: profit factor divides the winning side by the losing side, expectancy subtracts one from the other. Division gives you a ratio, subtraction gives you money.
The breakeven win rate
breakeven win rate = average loss ÷ (average win + average loss)
This is the win rate your reward-to-risk needs before costs, and it settles most arguments about win rate on the spot:
| Reward to risk | Breakeven win rate | Meaning |
|---|---|---|
| 1 : 1 | 50.0% | Right half the time, just to stand still. |
| 2 : 1 | 33.3% | Wrong twice as often as right, and still ahead. |
| 3 : 1 | 25.0% | One in four. |
| 1 : 2 | 66.7% | Two in three, every month, forever. |
In the worked example above the setup is 2:1, so it needs 33.3% and it got 40%. The edge is those 6.7 percentage points, and nothing else.
Before costs is doing real work in that sentence.
Costs can arrive in up to five separate columns: commission,
clearing, exchange, IP and NFA fees. Which of them carry a value
depends on the commission template configured on your account, so keep
every column the export offers rather than reading
Commission alone and concluding your costs are a fraction
of what they are. The
export guide
covers which file to pull.
Max drawdown, and why recovery is not symmetric
The largest peak to trough fall in the period. It matters more than the final number because it is the part you have to sit through, and because getting back is harder than falling was:
gain needed to recover = drawdown ÷ (100% − drawdown)
- Down 10% needs 11.1% to get level.
- Down 20% needs 25%.
- Down 50% needs 100%, a doubling, to arrive back where you started.
That curve is the whole argument for position sizing. It is not caution for its own sake, it is that the arithmetic of getting back turns against you faster than the arithmetic of losing does.
What the report cannot tell you
Every number above is an outcome. None of them describe behaviour, and behaviour is usually what changed. A summary cannot see:
- Whether you re-entered within seconds of a loss, which is a different decision from the one you planned even when it wins.
- Whether a loss ran past the stop you normally respect.
- Which hour of the day your trading actually worked, and which hour quietly gave it back.
- Whether a good month was one good week and three flat ones.
Those need a row per trade rather than a total, which is what the Trades grid export gives you and what the Lab reads.
Small samples say less than they appear to. Twelve trades will produce a win rate and an expectancy, and both will move substantially on the thirteenth. Treat a number built from a handful of trades as a rough direction, not a measurement, and be especially careful about changing a working process on the strength of one.
Sources checked
- NinjaTrader 8 Help Guide, Statistics Definitions, the platform's own definitions of the statistics named here, including Profit Factor as a ratio of what a strategy earns to what it loses, and Max. Drawdown as "the biggest decrease (drawdown) in account size experienced from the highest high seen".
- NinjaTrader 8 Help Guide, Performance Displays, confirms the Summary display shows the statistics and that the Trades display is one row per completed transaction, "matched by the market position and quantity".
Related guides
How to export your trades from NinjaTrader 8
Three exports look alike and only one has a row per trade. The exact clicks, plus how to spot the two you did not want.
Position sizing against a drawdown limit
On an evaluation account the balance is not what ends you. A floor is, and it sits closer than the balance suggests.